
Behavioural economics has revealed the vast gulf that exists between what people say they want and how they behave.
It makes life exceedingly challenging for financial planners, superannuation funds and financial institutions attempting to deliver the right, high-quality products and services.
However, new approaches built on data, analysis and algorithms can help solve the contradictions of advising people who are effectively strangers to themselves.
The difference between stated and revealed preferences
Financial planning questionnaires typically ask clients for stated preferences–how they believe they will react in different circumstances–but decision theory and behavioural economics explain why people’s actions regularly deviate from their intentions.
For example, the second highest financial priority cited by seniors in a recent ASIC surveywas ‘having enough money to enjoy life and do what they want to do’ (69%). Yet a significant proportion of retirees spend less than the Age Pension according to the Milliman Retirement Expectations and Spending Profiles (Retirement ESP) analysis.
Meanwhile, the industry has long known that people’s stated preference for reliable retirement income doesn’t translate into sales of products such as annuities.
These inconsistencies suggest retirees are prone to stronger opposing forces that change their behaviour in ways they don’t realise. It makes setting personal goals a complex task because people don’t know themselves, let alone how to balance competing desires.
Big data plays a crucial role in revealing how retirees are behaving as opposed to how they think they’re behaving. The Milliman ESP has already revealed several surprises about the behaviour of retirees which differs from industry assumptions.
Shachar Kariv, the Benjamin N. Ward Professor of Economics and Department Chair at the University of California, Berkeley, recently pointed to gamification–the process of melding game-like actions with everyday tasks–as a more accurate methodology than questionnaires.
It can show how clients will actually behave (their revealed preferences) rather than how they think they will behave (their stated preferences).
“People will enjoy it because it will be a game,” Kariv said at a recent Milliman breakfast event. “It’s going to be fun and fast. You can do it from your phone or tablet and in different periods of time.”
For example, a coin flipping gambling game can reveal players’ risk-return trade-offs and preferences in a mathematically sound approach. Various studies are now showing, with statistical certainty, just how certain segments of the population behave by using these techniques.
The problem with risk
Understanding investment returns is a simple exercise: the numbers stand out in black and white. Understanding the risk that hides behinds those numbers is more complex.
Individuals may think of risk in terms of the possibility of investment losses or, more broadly, not achieving their financial goals. The asset management industry on the other hand typically defines risk in terms of the standard distribution of returns (volatility).
This disconnect between everyday Australians and investment professionals can lead to poor outcomes.
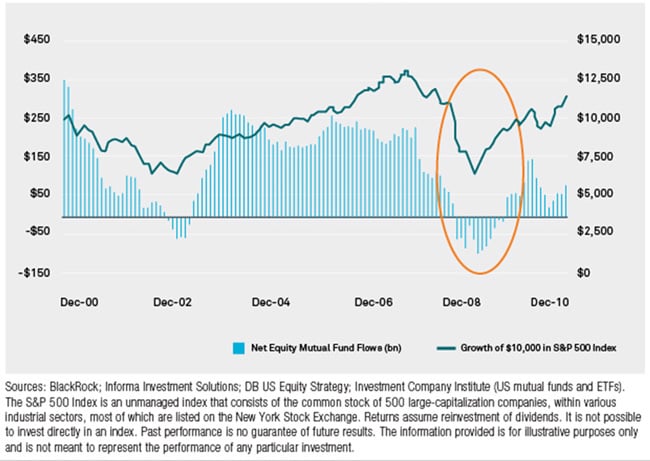
Further exacerbating the problem, many individuals make poor predictions (stated preferences) about their level of risk tolerance. The evidence is the number of investors who withdraw or switch their portfolios to cash when equity markets decline as shown in the graph below.
Figure 1: S&P 500 Index performance vs. 12-month equity mutual fund flows
A secondary issue is the way the industry gauges investors’ risk tolerance with standard risk and return questionnaires.
“I would claim there is no scientific basis whatsoever for this method,” said Kariv, who is also chief scientist at risk profiling firm Capital Preferences. “A survey is like designing a bridge without writing any mathematical equations. You will not drive on a bridge that the engineer has designed without writing any mathematical equations.”
Accurately measuring risk capacity, not just risk tolerance, is essential if investors want to achieve their goals. Risk capacity is the level of risk an investor can withstand while still meeting their objectives with a reasonable level of certainty.
For example, many older investors have higher levels of loss aversion, which leads to lower risk tolerance levels. However, wealthier investors with high levels of cash to fund their day-to-day lifestyle can also have higher levels of risk capacity.
This can be a crucial factor to assess when investors need to take on more investment risk to achieve their goals.
Risk capacity is also relevant for younger investors. The ASX Australian Investor Study 2017, which surveyed 4,000 Australian residents, suggests that young investors may be more risk averse than previously thought. It found that four in five young investors (81%) aged under 35 were seeking guaranteed or stable investment returns.
However, young investors have particularly high-risk capacity when it comes to their retirement savings, given that they will have decades in the workforce and can withstand market gyrations.
Analysis can discern the difference between risk preferences and risk capacity and help advisers balance the tension between them to find a solution that works for their clients.
We trust people when we should trust the machines (and vice versa)
People are bad at estimating what they spend, which makes it difficult to choose the optimal investment strategy to lift retirees’ standards of living.
The evidence is the Household Income and Labour Dynamics in Australia (HILDA) data, which surveys more than 9,500 households across Australia. It provides considerable valuable information and insight into everyday Australians. However, spending surveys of this nature have shortcomings when applied to the context of financial planning, which are revealed by Retirement ESP.
For example, an industry analysis estimated that the median expenditure for households aged 65-69 was $24,640 a year while the average was $33,944. Retirement ESP, which uses bank transaction data from more than 300,000 retirees, shows that the median couple aged 65-69 spends $34,858 while the average expenditure was $43,675. This is a significant difference even when accounting for the different time periods of the underlying data (2015 versus 2017).
Other differences are also revealed when people qualitatively assess their own lifestyle compared to a quantitative assessment of data.
For example, 2527 people surveyed in the 2015 HILDA survey said they smoke at least one cigarette a week. However, 38% of these respondents reported spending no money each week on cigarettes.
Also, HILDA data suggests that the average number of cigarettes smoked a week is 78, and the average amount spent on cigarettes each week is $82. This implies that individuals underreport the cost of smoking by almost 15%. (Assuming 30 cigarettes per pack and an average per pack cost of $30)
These discrepancies and contradictions in spending survey data are not necessarily material when taken in the appropriate context. However, they do highlight the potential risks of relying on spending survey data to form views about the spending needs of future retirees.
Financial advisers, and increasingly super funds, develop an understanding of clients’ and members’ qualitative information and life experiences because they spend time with them.
However, a mix of tools powered by data, analysis and algorithms can help them bridge the gap between the things people say they want and how they actually behave.
This type of quantitative information, which is provided in the Milliman Retirement ESP, is a key component of this approach and can provide a clearer view of retirement expectations and what people need to do to achieve their goals.
The article was first published on Milliman website.
The full Milliman Retirement ESP report is published to subscribers each quarter. Contact Milliman senior consultant Jeff Gebler at jeff.gebler@millilman.com for more details.
Disclaimer
This document has been prepared by Milliman Pty Ltd ABN 51 093 828 418 AFSL 340679 (Milliman AU) for provision to Australian financial services (AFS) licensees and their representatives, [and for other persons who are wholesale clients under section 761G of the Corporations Act].
These results are based on simulated or hypothetical performance results that have certain inherent limitations. Unlike the results shown in an actual performance record, these results do not represent actual trading. Also, because these trades have not actually been executed, these results may have under-or over-compensated for the impact, if any, of certain market factors, such as lack of liquidity. Simulated or hypothetical trading programs in general are also subject to the fact that they are designed with the benefit of hindsight. No representation is being made that any account will or is likely to achieve profits or losses similar to these being shown. Milliman does not manage the underlying fund.
To the extent that this document may contain financial product advice, it is general advice only as it does not take into account the objectives, financial situation or needs of any particular person. Further, any such general advice does not relate to any particular financial product and is not intended to influence any person in making a decision in relation to a particular financial product. No remuneration (including a commission) or other benefit is received by Milliman AU or its associates in relation to any advice in this document apart from that which it would receive without giving such advice. No recommendation, opinion, offer, solicitation or advertisement to buy or sell any financial products or acquire any services of the type referred to or to adopt any particular investment strategy is made in this document to any person.
The information in relation to the types of financial products or services referred to in this document reflects the opinions of Milliman AU at the time the information is prepared and may not be representative of the views of Milliman, Inc., Milliman Financial Risk Management LLC, or any other company in the Milliman group (Milliman group). If AFS licensees or their representatives give any advice to their clients based on the information in this document they must take full responsibility for that advice having satisfied themselves as to the accuracy of the information and opinions expressed and must not expressly or impliedly attribute the advice or any part of it to Milliman AU or any other company in the Milliman group. Further, any person making an investment decision taking into account the information in this document must satisfy themselves as to the accuracy of the information and opinions expressed. Many of the types of products and services described or referred to in this document involve significant risks and may not be suitable for all investors. No advice in relation to products or services of the type referred to should be given or any decision made or transaction entered into based on the information in this document. Any disclosure document for particular financial products should be obtained from the provider of those products and read and all relevant risks must be fully understood and an independent determination made, after obtaining any required professional advice, that such financial products, services or transactions are appropriate having regard to the investor's objectives, financial situation or needs.
All investment involves risks. Any discussion of risks contained in this document with respect to any type of product or service should not be considered to be a disclosure of all risks or a complete discussion of the risks involved.